This is a facade system which can react to light and alters to these changes.
http://www.youtube.com/watch?v=7CThFRt95aI
Thursday, February 17, 2011

Monday, February 14, 2011
some research stuff
This shows the cabs in motion in San Francisco the colours indicate the speed the day i think its really cool.
http://cabspotting.org/timelapse.html
Friday, February 11, 2011
Thanks to Kim for the following links:
http://21stcenturyurbansolutions.wordpress.com/tag/bayview-hunters-point/
http://scotthaefner.com/photos/place/Hunters+Point+Naval+Shipyard/2959/
http://21stcenturyurbansolutions.wordpress.com/tag/bayview-hunters-point/
http://scotthaefner.com/photos/place/Hunters+Point+Naval+Shipyard/2959/
Multiple Exposures
Images of Movement - a good starting place for your drawings. Remember, we are not tracing. The drawings should be abstract interpretations of movement, see the previous posts...


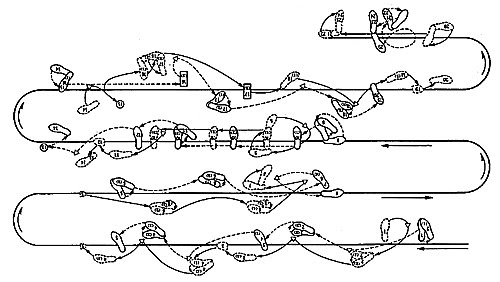


What Your Maps Should Look Like
Some maps examples in case you missed them the first time:
On the left are maps of speed and buffers around points of significance. These begin to merge together at their nearest points, creating the effect of a cloud, or atmosphere. On the right are more localized phenomenon over time - the volume and speed of traffic:

Color coding by address:

Average MUNI speeds:

Crime Map:

On the left are maps of speed and buffers around points of significance. These begin to merge together at their nearest points, creating the effect of a cloud, or atmosphere. On the right are more localized phenomenon over time - the volume and speed of traffic:

Color coding by address:

Average MUNI speeds:

Crime Map:

Subscribe to:
Posts (Atom)